Christopher Hanusa talks about his career in math and art in view of his upcoming solo show "Existence and Uniqueness" with Gallery 1064.
Who is Christopher Hanusa? Tell us more about you and your art.
My name is Christopher Hanusa; I am a professor of mathematics at Queens College of the City University of New York. I earned a PhD in Mathematics from the University of Washington in 2005.
I create mathematical art using computational software and bring it to life through 2D and 3D printing methods. I take advantage of the precision and beauty of mathematics to present striking geometric forms using bold color schemes. My artwork draws on my varied mathematical interests including discrete structures and the theory of reflection groups. My works are often generative in nature, which means they are infused with random processes. A key emphasis of my art is on the tension between randomness and deliberation.

What is the focus of your research?
My research can be broken down into two major areas. My mathematical area of research is combinatorics, which is the study of methods to count discrete objects more effectively. A combinatorial question I often give as an example is “How many ways there are to completely cover an 8x8 chessboard with 32 blank dominoes?”. Each domino can be placed vertically or horizontally, which shows that there are likely many different solutions. In fact, the number of arrangements is exactly 12,988,816. I would argue that it is more important to know HOW to find that answer than WHAT the precise number is. In this type of research, one technique I use is to generate all possibilities in a computer and extract information from them. Once I have enough information, I can conjecture a rule and use mathematical techniques to prove the rule. This process sometimes goes by the name of experimental mathematics.
My other area of research is using data analysis to understand the aesthetics of art. One major project was a collaboration with science artist Emily Garfield, who creates striking cellular artwork that can take on a feel of an imaginary city. I analyzed six pieces from her cityscape collection to determine properties about the color scheme, and distributions of various metrics like block sizes, road orientation, and density to determine if there is a defining property of her artwork in the goal of determining “What makes a map.” Another project, joint with students Christopher Soto and Peter Antonaros is an exploration of the aesthetics of generative art. We have set up a website artvote.net with 4000 randomly generated images and ask visitors to rate the artwork on a scale from least to most aesthetically pleasing. We have over 130,000 votes to date and are now starting to analyze the properties that make one piece of generative art better than another.
How do you juggle being a successful professor of mathematics and a successful mathematical artist? How do the art life and the academic life feed into each other?
My life as an artist is intimately connected with my profession as a professor. My role as a professor is to search out the new, explore connections between fields, and share my knowledge and experience with students and the public. I have always used visualizations to understand mathematical concepts in my studies and my research. And I have always found the visual component of explanation important for conveying mathematical truth.
In 2015 I reimagined course called Mathematics with Mathematica as a project-based class. Students learn the basics of the computational software Mathematica and complete three projects including a tutorial, an interactive app, and a 3D design project in which students apply mathematical principles or mathematical techniques to design a mathematical sculpture. This helped to unleash the creativity of my students (and myself), and it was my first foray into 3D printing.
 Another experience where my teaching inspired some artwork is when I gave myself a challenge to create a piece of art related to the Integral Calculus class I was teaching. A few of these artworks are part of this solo show, including Riemondrian, a mash-up between Riemann sums and Piet Mondrian’s De Stijl.
I attend academic conferences, including the Bridges Conference, a yearly global conference that celebrates the math art community. Attendees span a spectrum between mathematicians by training who find the best way to visualize mathematical research to artists by training who have been inspired by mathematical ideas.
How do you create your art?
When I am creating art, I start with a nugget of inspiration from theoretical mathematics or the physical world and I try to recreate the idea using computer code. If it is a mathematical idea, I start with its definition or formula; if I am inspired by something from the physical world, I create an algorithm that manifests the apparent structure. Once I have working code that faithfully recreates a desired structure, I try to push the idea further. Are there any self-imposed limitations that can be transgressed? Can I modify a particular artistic or aesthetic property yet keep the original ethos? What parameters can I introduce into the code to explore a wide spectrum of possibilities? How can color be algorithmically added and which color schemes are suitable? As I develop my code, I rely on my knowledge from multivariable calculus, linear algebra, trigonometry, and geometry.
My artistic medium is the computational software Wolfram Mathematica, which has rich visualization capabilities and easily exports to digital image and 3D printing formats. In fact, the Wolfram Language is constructed to work seamlessly throughout all its strengths. The same techniques that apply to assembling geometric scenes apply to computer algorithms and to visualization and to data analysis and the list goes on and on. The cohesiveness of the programming language and the quality of its documentation provides a strong structure which gives me the freedom to explore its universe creatively, incorporating whatever mathematical ideas I might need or desire. I enjoy being able to push boundaries by using all the tools at my disposal and intertwining them in novel ways.
Does everything that is algorithmically generated make the final cut or is it curated?
Because I integrate randomness into the artwork, not every result is going to be pleasant. Once the code is generating the desired effect, the beauty of a generative framework means that I can rerun the code with new random numbers to generate an alternate version of the piece. I might iterate this multiple times until I see something that catches my eye or I might generate dozens of different variations so that I can find the one that most encapsulates the essence of what I'm going for.
Often this process is iterative: I might start off with a structure that I like and modify parameters until it is optimal. At that point I hold those parameters constant as I change something else about the project—for example the distribution of the sizes of blocks—and once I’ve decided that that parameter is right, I will hold it fixed as well. At each step of this process there is randomness that helps to inform what the final piece will become but once the randomness yields something that fits my definition of good, I fix that aspect and develop other aspects of the piece.
There is also something to be said for happenstance—I find that mistakes in my code can produce better results than what I originally set out to do.
Tell me more about RiemannScapes, Window Evolution, and Streamlines?
All three collections are 3D printed sculptures. All pieces in RiemannScapes and Window Evolution have been created using a generative algorithm and derive their uniqueness from this process.
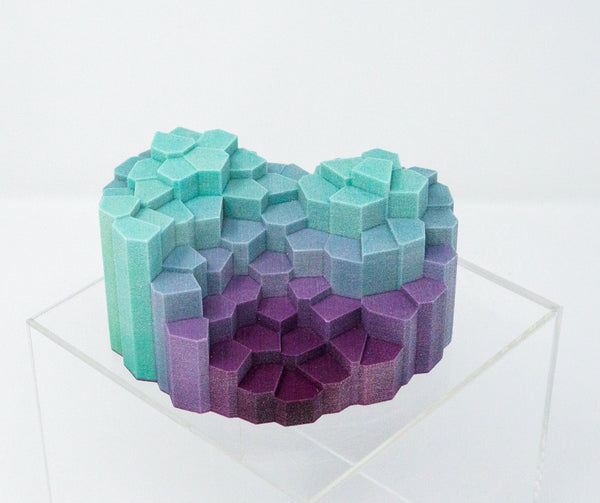
RiemannScapes sculptures are based on the classic idea of a Riemann sum from calculus. Let me explain. You can easily calculate the volume of water in a rectangular aquarium by multiplying the length of the aquarium by the width of the aquarium by the height of the water. On the other hand, it is much more difficult to calculate the volume of water in a lake since the shape of the lakeshore is irregular and the height of the water is not constant because there is variation in shape of the lake bed and the height of the waves. This is where calculus comes in. If you break up the surface of the lake into small squares and you measure the height of the water in that square, you can use the length x width x height calculation to determine the amount of water in that region. Adding together these smaller volumes is going to give you a good approximation for the total amount of water in the lake. Each RiemannScape sculpture involves breaking up the base into many smaller pieces using a Voronoi diagram, and raising each piece to the height of a defining function. Then a generative coloring scheme is added to give the feeling of a landscape. Each piece in the series is entirely unique because the points used to partition the base are randomly generated, the functions determining the heights are unique, and the colors are placed algorithmically based on the points and the function.
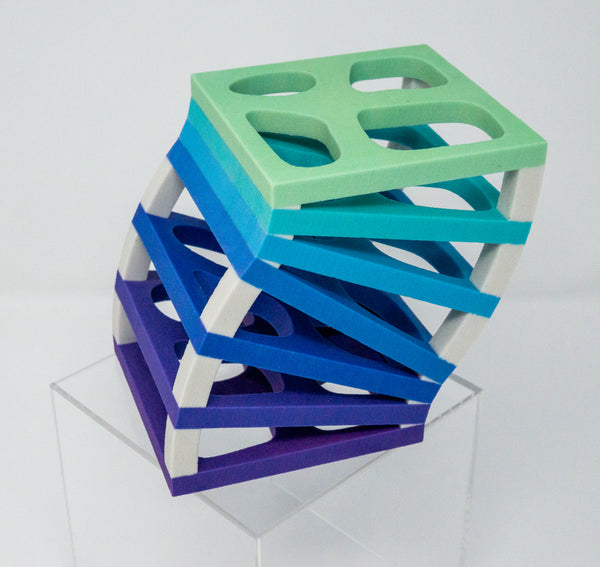
Window Evolution explores the evolution of an abstract scene in snapshots over time. If you through a ball through an open window and record the shape of the slice of the ball lying in the plane of the window, you will see a small circle that gets larger and larger and then gets smaller and smaller. If you sample a few of these frames, you would have a discrete visualization that you could reassemble into the original ball. In Window Evolution, there are multiple slices of a scene over time. The abstract forms change shape and size as you pass from window to window. You can see each individual frame by looking in from the sides; by looking from one side you can recreate the entire form in your mind. In these sculptures I very much enjoyed the play between positive and negative space.
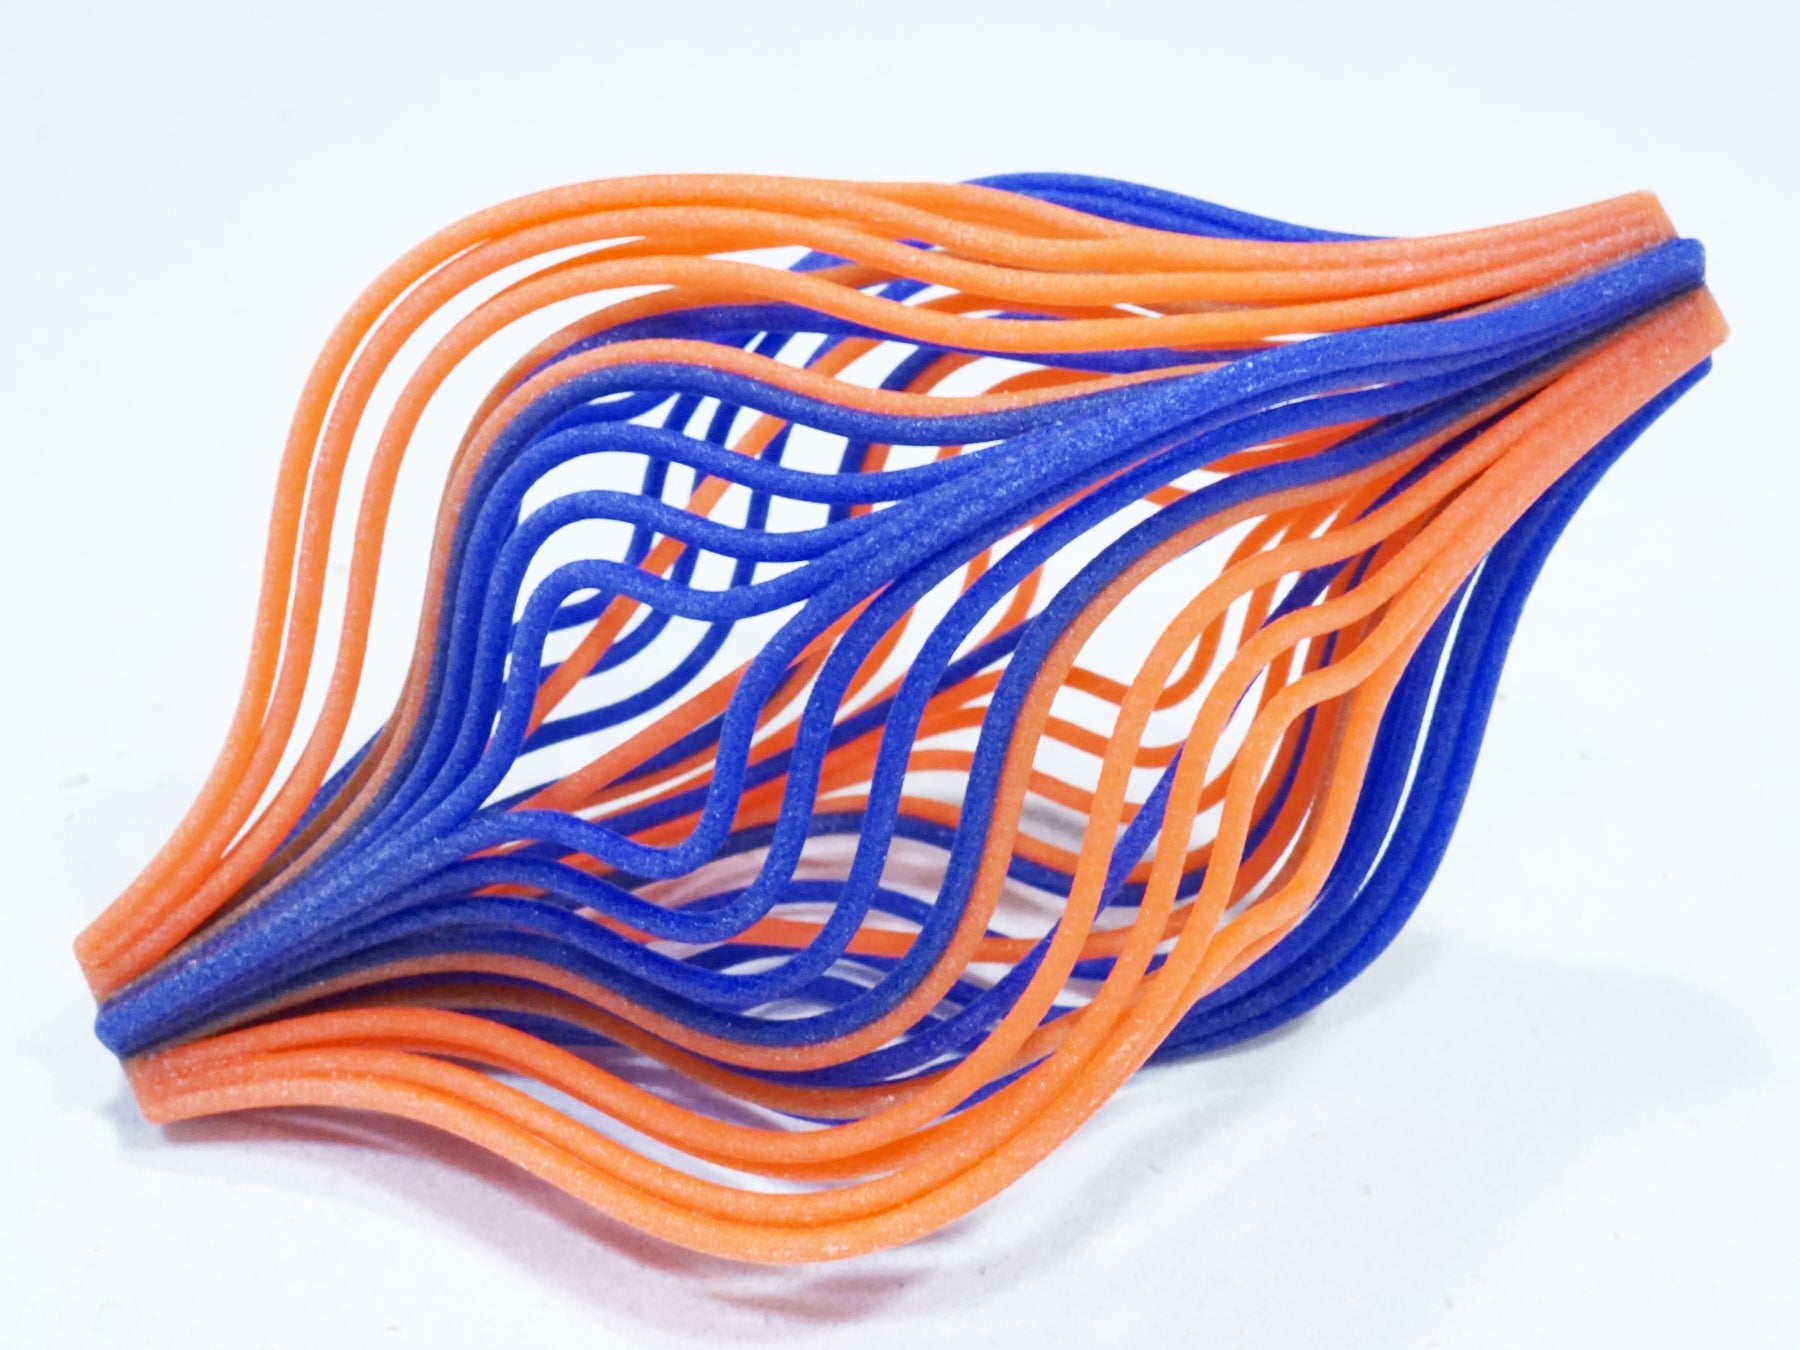
Streamlines explores the streamlines of vector fields. A vector field is an assignment of a direction to every point in space. A streamline is the path that a particle in the vector field would follow if acted upon by the associated directions. An example of a vector field is the direction the wind is blowing; a plastic bag that is released at some location would follow a streamline. Divergent Stream is a model of the streamlines in the vector field ⟨y,z,x⟩; the streamlines exhibit spiraling behavior around the axis parallel to the vector ⟨1,1,1⟩. Shallot Stream is a model of the streamlines in the vector field ⟨1/x²,1/y²,1/z²⟩; the dichotomous colors show that equally spaced streamlines at one end arrive in bunches near the other end.
What are you currently working on, beside this solo show and your classes?
I also design and sell mathematical jewelry under the brand Hanusa Design. This wearable art is designed using Mathematica and then 3D printed in different materials, including silver and brass through a lost-wax casting method and nylon through a selective laser sintering method and subsequently hand dyed in bright colors. A variety of museums, galleries, and stores stock Hanusa Design Jewelry, including the National Museum of Mathematics in New York, NY and the Exploratorium in San Francisco, CA. The whole collection of jewelry is available at hanusadesign.com. Gallery 1064 visitors have a special discount of 10% off all jewelry through March, 2022 by entering promo code 1064.
Christopher Hanusa will exhibite at Gallery 1064 with Existence and Uniqueness, a solo show that blurs the boundaries between art and math, between the intangible and the corporeal, between impermanence and calculation.
0 comments


